Cause and effect diagram is usually called fish-bone diagram because of its shape. It was originated by Dr. Karoru Ishikawa, so it is also known as Ishikawa diagram. It is an effective tool used to trace root causes of problems or troubleshooting.
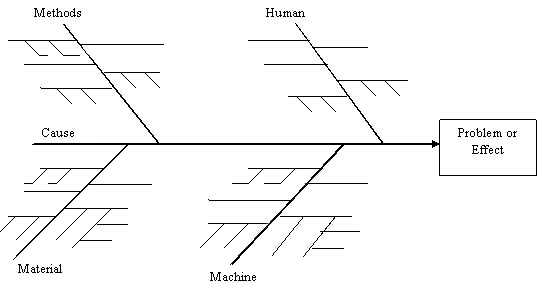
Any manufacturing process can basically be divided into four major categories in terms of causes, which have an impact on the quality characteristics (effects). the four categories that are usually employed in conjunction with cause and effect diagrams are man (more appropriately people), machine, method and materials. These are traditionally called 4 M's in the manufacturing process. The following figure shows a basic shape of a cause and effect diagram.
The diagram is a format for logically aligning the possible causes of a problem or effect. As the ideas are presented, they are inserted as "bones", or possible causes of the effect, in the appropriate category. The bones can be sub-categorized as causes of a cause are presented. The subdividing continues until the root cause to the problem is found. There may not always be a single root cause, but at least a few potential root causes will surface.
The 4 M's are generally used as the initial main categories for a cause and effect analysis. Other categories specific to the particular process may be added if the team decides they are important. A major cause may also be divided into two or several causes. For example, machine can be divided into mechanism, measurement and control.
The steps in constructing the cause and effect diagram is as follows:
1. Define the problem or effect to be analyzed.
2. Form the team to perform the analysis. Often the team will uncover potential causes through brainstorming.
3. Draw the effect box and the center line for the effect.
4. Specify the major potential cause categories and join them as boxes connected to the center line.
5. Identify the possible causes and classify them into the categories in step 4. Create new categories if necessary.
6. Rank order the causes to identify those that seem most likely to impact the problem.
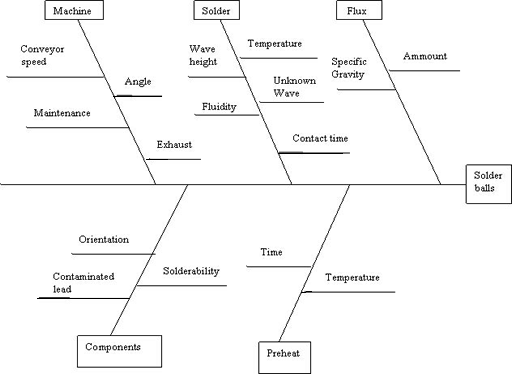
7. Take corrective action.Example: This example is a wave soldering operation that occurs in a printed circuit board manufacturing operation. The quality characteristic monitored in this operation is the number of solder balls. After brainstorming, the causes are classified in the following categories.
Machine (Conveyor):
Speed
Angle
Maintenance
ExhaustSolder:
Wave height
Temperature
Unknown wave
Fluidity
Contact timeFlux:
Amount
Specific gravityComponents:
Orientation
Solderability
Contaminated leadPreheat:
Time
TemperatureThe cause and effect diagram is constructed as following:
WORKING EXAMPLE
Make a cause and effect diagram for the following problem: The car refused to start. A team brainstorms the problem and identifies the following categories of possible causes.
Machines
Carburetor problem
Wiring problem
Computer malfunction
Electrical trouble
Measurement
Faulty gas gage
Methods
Flooded engine
Standard: clutch must be in
Automatic: must be in neutral or park
Wrong car
Wrong key
Seat-belt not fastened
Materials
No gas
No oil
Oil too thick (cold)
Dead battery
Loose battery connection
Faulty spark plugs
Plugged gas line
Air cleaner to dirty
School of Technology
College of Business & Applied Sciences
Eastern Illinois University