A defect concentration diagram is a picture of the unit, showing all relevant views. Then various types of defect are drawn on the picture, and the diagram is analyzed to determine whether the location of the defects on the unit conveys any useful information about the potential causes of the defects.
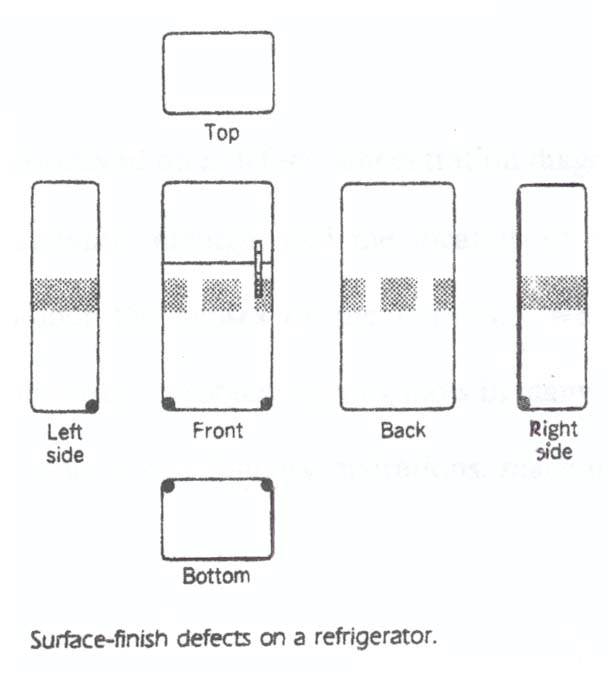
The following figure presents a defect concentration diagram for the final assembly stage of a refrigerator manufacturing process. Surface finish defects are identified by the dark shaded areas on the refrigerator. From inspection of the diagram it seems clear that the materials handling is responsible for the majority of these defects. The unit is being moved by securing a belt around the middle, and this belt is either too loose (tight), worn our, made of abrasive material, or too narrow. Furthermore, when the unit is moved the corners are being damaged. It is possible that worker fatigue is a factor in this process. In any event, proper work methods and improved materials handling will likely improve this process dramatically.
Surface-finish defects on a refrigerator.
The following figure shows the defect concentration diagram for an aerospace tank. Notice that this diagram shows several different broad categories of defects, each identified with a specific code. Often different colors are used to indicate different types of defects.
When defect data are portrayed on a defect concentration diagram over a sufficient number of units, patterns frequently emerge, and the location of these patterns often contains much information about the causes of the defects. We have found defect concentration diagrams to be important problem solving tools in many industries, including plating, painting and coating, casting and foundry operations, machining, and electronics assembly.
WORKING EXAMPLE
Draw a defect concentration diagram for an auto-body:
1. Brainstorm the possible defect types.
2. Assign codes to each defect category.
3. Draw diagram to show the whole view of the auto-body.

School of Technology
College of Business & Applied Sciences
Eastern Illinois University