In manufacturing process, there may be many variables causing problems. For example, the surface finishing of a product is affected by cutting speed, feeding rate, lubricant and so on. Designed experiments are extremely helpful in discovering the key variables influencing the characteristics of interest in the process.
A designed experiment is an approach to systematically varying the controllable input factors and observing the effects of these factors on the output product parameters. Statically designed experiments are invaluable in reducing the variability in the quality characteristics and in determining the levels of the controllable variables that optimize process performance, such as surface finish. Designed experiment is a major off line problem solving and quality control tool. It is often used during product development activities and the early stages of manufacturing, rather than as a routine on line or in process control procedure.
The objective of the experiments include:
1. Determine which variables are most influential on the product performance.
2. Determine where to set the controllable variables so that the performance is near target (nominal requirement).
3. Determine where to set variables so that the variability is small.
4. Determine where to set the variables so that the effects of the uncontrollable variables (sometimes called noise) are minimized (robust design).
Successful Example:
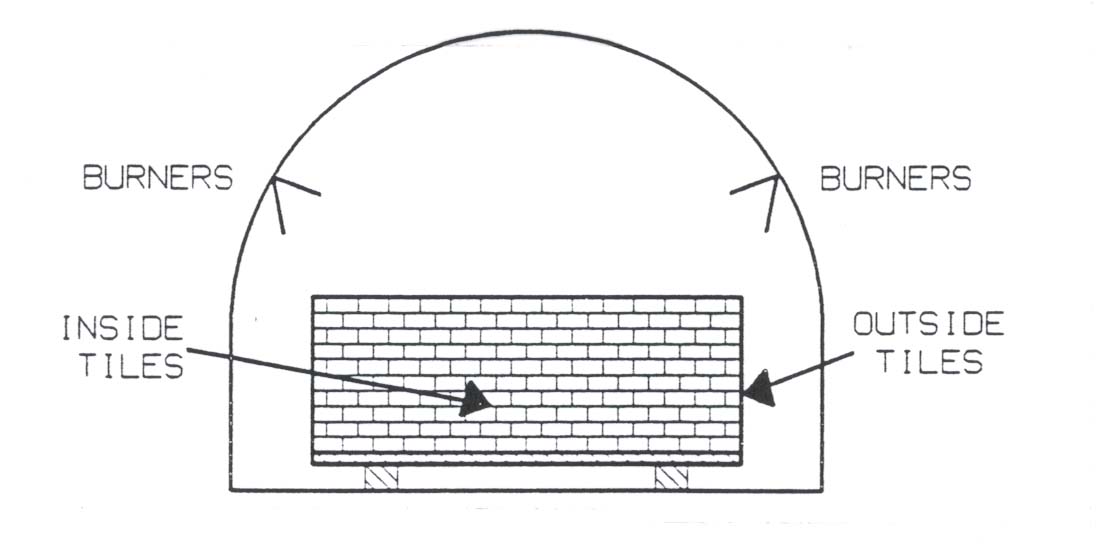
A mid-size tile manufacturing company in Japan in 1953 was having a serious problem with their $2 million kiln purchased from West Germany. The problem was extreme variation in the dimensions of the tile produced. The stacked tiles were baked inside a tunnel kiln as shown below. Tiles toward the outside of the stack tended to have a different average dimension and exhibited more variation than those toward the inside of the stack.
The cause of variation was readily understandable. There was an uneven temperature profile inside the kiln. To correct the cause, the company would have to redesign the kiln, which was a very expensive proposition. This company's budget did not allow such costly action, but the kiln was creating a tremendous financial loss for the company, so something had to be done.
Because the temperature control was expensive to change, other options were looked for so that the process will not be as sensitive to the temperature variation. People from different functional groups like engineers and chemists were brought together. They brainstormed and identified seven major controllable factors which they thought could affect the tile dimension. These were:(1) Limestone content in the raw mix;
(2) Fineness of the additives;
(3) Agalmatolite content;
(4) Type of agalmatolite;
(5) Raw material quantity;
(6) Waste return content;
(7) Type of feldspar.
The temperature was treated as uncontrollable variable (noise).
After testing these factors over specified levels using an orthogonal design, the experimenters discovered that factor #1 (limestone content) was the most significant factor, although other factors had smaller effects. It was found that by increasing the limestone content from 1% to 2% (and by choosing a slightly better level for other factors), the percent warpage could be reduced from 30% to less than 1%. Fortunately, limestone was the cheapest material in the tile mix. Moreover, they found through the experimentation that they could use a smaller amount of agalmatolite without adversely affecting the tile dimension. Agalmatolite was the most expensive material in the tile.
This is a classic example of improving quality (reducing the impact of a noise factor), reducing cost (using less agalmatolite) and drastically reducing the numbers of defectives at the same time.When there are several factors of interest in an experiment, a factorial design should be used. By a factorial experiment we mean that in each complete trial of the experiment all possible combinations of the levels of the factor are investigated. Thus, if there are two factors A and B with 2 levels of each factor (L for lower level, H for higher level), the experiment will be arranged as follows.
Or tests for the two variable/two level experiment will be organized as in the following table.
For example, in order to have the best surface finish, it is decided to find the best cutting speed and feeding rate. Two levels of the variables will be tested.
Cutting speed: 400 rpm (L) and 800 rpm (H)
Feeding rate: 0.02 in/min (L) and 0.05 in/min (H)
The tests will be arranged according to above tables in the following table.
WORKING EXAMPLEAutomobile fuel efficiency. It is decided to study the effects the running speed and altitude on the fuel efficiency with two factor two level experiment. After barnstorming, the following parameters are to be tested.
Speed: 50 mph and 75 mph
Altitude: 2000 ft. and 5000 ft.
Design a two factor/two level experiment to study the effects of speed and altitude on the fuel efficiency.
Experimental Design Meets the Realities of the 1990s
"Major changes are required of U.S. businesses if they are to succeed in the global marketplace"
APPROACHES THAT MADE COMPANIES successful in the 1960s, 1970s, and 1980s are out of touch with the realities of the 1990s. In the 1980s. American companies recognized that a new way of doing business was needed. Instead of revolutionizing the corporation, however, only minor changes were made in the way business was done. Company management proclaimed commitment to quality improvement. Dro\es of employees were trained to use new tools, pilot projects were attempted, and some improvements were made.
The sad reality for many in corporate America is that company management still proclaims commitment but provides minimal resources for training and pilot projects. In other words, management talks the talk but does not walk the walk.
Minor change is not how America will stay competitive. Revolutionary changes are required in how businesses are managed and teams are educated, specifically in experimental design. Since the early 1980s, many companies have implemented training geared toward helping engineers make experimental design a too! they use regularly. Some companies have made great strides; others have not.
The seven realities of the 1990s
For those teaching, implementing, or applying experimental design techniques, there are seven key issues—realities of the 1990s—that must be addressed:
Reality1
Experimental design is a strategic weapon to battle competitors worldwide by designing mbust products, reducing time lo market, improving quality am! reliability, and reducing life-cycle
cost. Author Michael Dertouzos. in Made in America, found six recurring patterns of weaknesses in U.S. companies that keep them from being competitive in the world marketplace :
1. Outdated strategies
2. Short time horizons
3. Technological weaknesses in development and production
4. Neglect of human resources
5. Failure lo cooperate
6. Government and industry being at cross purposes
The third item—technological weaknesses in development and production—does not relate to the invention process but rather to the process of turning new inventions into useful products. The design processes used by U.S. companies in the past have tended to produce designs that were overly complex and did not necessarily focus on customer requirements. Design processes should develop robust products and processes. Robust means that they perform their intended functions regardless of customer-imposed usage environments, manufacturing variations, variations imposed by suppliers, and degradation over the useful product life. Experimental and robust design techniques, coupled with quality function deployment (QFD) and concurrent engineering initiatives, are powerful tools used to make this a reality.
For example, a fundamental requirement of QFD is to determine the strength of relationships between customer and technical requirements, technological requirements and part characteristics, and part characteristics and process characteristics.
Simple relationships (particularly between customer and technical requirements) might already be part of the body of engineering knowledge. Often, however, complex relationships are not understood. In these cases, experimental design techniques that use powerful orthogonal arrays can reveal these relationships.
Another shortcoming of traditional U.S. design processes is that required design times are excessive. In 1984, leading computer disk-drive makers frequently took up to five years to develop and produce new data-storage devices. Today, leading companies, dictated by market requirements, do this in as little as 16 months. Experimental design is the strategic weapon for reducing time-to-market by learning as much as possible about a product or process in a minimal amount of time.
As part of QFD. experimental design helps people understand the relationship between customer quality requirements and process parameters. Empirical math models relating input parameters to quality characteristics, along with robust design, increase product reliability.
Experimental design used in research and development phases maximizes information with minimum resources. Engineers need to produce robust designs quickly and cheaply. Products and processes must be made robust before they go to manufacturing because waiting to make products and processes robust in the manufacturing stage is too late and costly. With each life-cycle phase of a product, the cost of failures increases greatly.
Experimental design used to create robust designs with increased quality and reliability will decrease overall life-cycle cost.
Reality 2
Development, design, and manufacturing must all apply experimental design techniques wisely. Different groups in an organization have different experimental design needs (see Figure 1). For example, the manufacturing troubleshooting people need to competently use orthogonal arrays and simple analysis techniques. When operating in a troubleshooting mode, they don't need to learn everything from their experiments— just enough to fix the problem and move on to the next one. Modeling, on the other hand, is quite different. These researchers need to learn a great deal about the problem. Because of this, useful families of orthogonal arrays include central composite designs. Regression analysis techniques must be used to generate the applicable predictive model.
All functional groups can benefit from the tools of experimental design. Different groups, however, need to emphasize different tools.
Reality 3
Science and engineering knowledge must be used when selecting responses. Consider the example of a photoresist process for multilayer, printed circuit boards. Photoresist is a light-sensitive material used to mask underlying layers from chemical etchants. Possible control factors for the process include developer concentration, spray pressure, temperature, and exposure energy. Line width is a key customer requirement. One approach would be to evaluate a yield-related response— the percentage of parts meeting the specification. A better response is to evaluate line width on a categorical scale (below specification, meeting specification, or above specification). A third, and best, way is to assess the actual line-width measurement and treat it as a continuous response value.
Suggested guidelines to select responses are:
• Choose a continuous response whenever possible.
• Find a response that is easy to measure. The measurement systems must be precise, accurate, and stable.
• Begin with the customer requirement.
• Select a response that relates to the engineering function of the subsystem or process.
• For complex systems, attempt to break them into subsystems. Run experiments at the subsystem level. As a rule of thumb, consider one experiment for each critical engineering function.
• Focus on the engineering function and not on problems.
Reality 4
Applying experimental design techniques involves blending engineering, planning, communication, team, and statistical skills. In the past, statistical skills have been overemphasized, Fifteen years ago. it was not unusual to attend a 10-week statistics course in which the student did nothing but crunch numbers. While the student became competent in plugging numbers, he or she was not able to perform designed experiments.
In today's environment, applying orthogonal arrays to real problems requires skill diversity, the least of which requires the ability to crunch numbers with a calculator. Technical knowledge and the ability to plan, implement, and communicate are essential. The industrial experimentation process has five stages: forming and storming, selecting an orthogonal array, conducting the experiment, conducting analysis, and getting confirmation and reaching conclusions.
In the forming and storming stage, primary activities include:
• Generating a problem or opportunity statement
• Selecting an objective
• Determining the experimental response
• Identifying control factors, noise factors, and number of levels To be successful in this area, a team must have knowledge of customer requirements; an understanding of the objectives; technical knowledge; available resources and time; and team, facilitation, and communication skills.
The second major activity—selecting an orthogonal array— was once the domain of statisticians. But no longer must each design be generated by hand. Thanks to tabled orthogonal arrays and easy-to-use software, an engineer can quickly be guided in selecting the proper orthogonal array to fit the problem.
The third stage—conducting the experiment—requires a detailed plan, discipline in following the plan, and an understanding by the whole team of what the experiment will accomplish. Most texts on design of experiments (DOE) give little or no attention to this stage. It is, however, one of the biggest reasons people obtain poor results from an experiment. Those involved must realize that the only changes to be made are those called out in an orthogonal array. All other potential sources of variation must be held constant (or as close to constant as possible).
It is unfortunate that the fourth stage—conducting analysis— is still seen by some as what experimental design is all about. For example, many DOE courses and texts might spend as much as 80% to 90% of their time in this area. Analysis of variance and regression are typically touted as the techniques of choice. Recent revelations, however, have shown that with simple graphs and elementary math, a solid understanding of orthogonal array experiments can be obtained.
The last major step—getting confirmation and reaching conclusions—is the proof-in-the-pudding step. At this stage, the predicted best settings from the analysis stage are run in combinations, with four to 20 repetitions (depending on cost). If the results of the confirmation match the predicted values, the experiment has been confirmed. If not, this indicates that one or more of the assumptions was incorrect. Failure to confirm the experiment's results requires a search for the reasons of unpredictability prior to initiating new experimental trials.
Using engineering, planning, communication, teamwork, and statistical skills throughout the experiment will lead to more successful results.
Reality 5
Guru worship must be avoided—learn from all. Jack Nicklaus doesn't compete in a golf tournament with just his three favorite clubs. He uses a full set. Likewise, quality professionals should use a full set of experimental designs from many quality experts. Since organizations are faced with a diversity of challenges, it makes sense to take the best strategies from each expert and use what works.
Reality 6
Teaching must be simple and straightforward. When teaching DOE, don't overwhelm students with a dizzying array of fractional factorials and matrix algebra. Cut to the chase and keep it simple.
Reality7
A focus on variance reduction is essential. Until recently, most people assumed that variability was constant over the entire experimental region. Designed experiments focused on the factors that shifted the average. A new method has emerged in the last few years in which factors that shift the average and factors that impinge on the variation are both taken into account.
For example, a company that produced a machine part discovered that its process for making the part was not meeting specifications. In fact, 100% audits were initiated that resulted in nearly $200,000 of scrap and rework. A simple screening experiment was set up and run. The experimental-design orthogonal array and coded results found that, of the two control settings used, one caused a higher standard deviation. The setting was a factor that impinged on variation of the entire process. By changing the setting, the company dramatically reduced the part's variation, scrap, and rework.
Few have learned to use experimental design to provide reduced variation. Leading companies, however, will learn to make use of this method.
Realities can help you gain an edge
The realities of the 1990s emphasize key aspects of becoming competitive on a worldwide basis. Organizations that make these realities part of their day-to-day operations will be one step ahead of the competition.
Reference
Susan Blake, R.G. Launsby, and Daniel L WeeseMichael Dertouzos, Made in America (Cambridge, MA: Massachusetts Institute of Technology, 1989).
Susan Blake is a statistician at CH2M Hill in Denver, CO. She earned a master's degree in biometrics from the University of Colorado Health Sciences Center in Denver. Blake is a member of ASQC.
R.G. Launsby is the president of Launsby Consulting in Colorado Springs, CO. He holds a master's degree in engineering from the University of Nebraska in Lincoln. Launsby is a certified quality engineer, a certified reliability engineer, and a member of ASQC.
Daniel L. Weese is an associate at Logicon RDA in Colorado Springs, CO. He received a master's degree in applied mathematics from Harvard University in Cambridge, MA. Weese is a member of ASQC.
School of Technology
College of Business & Applied Sciences
Eastern Illinois University