TEC 5970/INT 5970 Problem Solving
LOSSES CUT 76 PERCENT WITH CONTROL CHART SYSTEM
(Case Study)
Demos charting method improves product quality at compressor plant.
By P. J. Cooper and Nick Demos
The Ingersoll-Rand Energair plant at Davidson, NC, is a small plant with a big success story. This plant reports success in dramatically reducing manufacturing losses—a 76 percent reduction over 10 months.
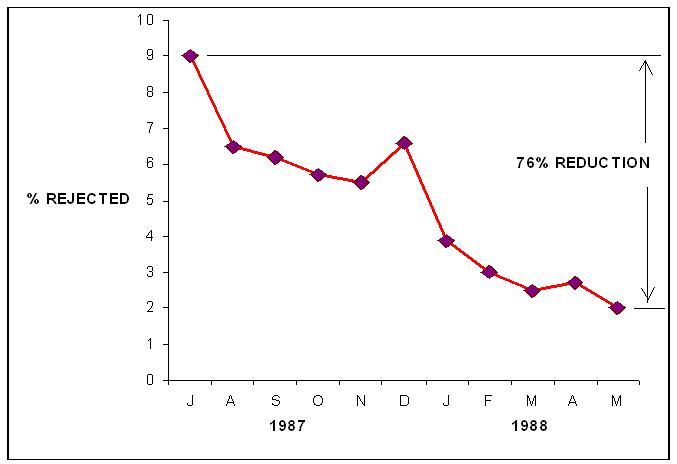
These results were achieved through the use of statistical process control (SPC). Figure 1 shows the monthly downward trend of rejections at final test.
The IR plant is strictly an assembly and test operation for small air compressors used to operate air tools. The compressors are used in the highly competitive do-it-yourself consumer market, with sales in the construction and trades markets as well.
All manufactured parts for the compressors are shipped to the plant. A close relationship is therefore maintained between the plant and its suppliers. Packaging and distribution of the compressors are also handled from this facility.
Figure 1. Monthly downward trend of rejections at final test
ASME-1 coded air receivers are grit-blasted, painted, baked and sent to the assembly process. There are two basic assembly lines: the "tilt piston" line and the "portable/vertical" package line. The tilt piston line assembles a 3/4 hp tankless compressor and motor subassembies. Other typical subassemblies at Energair are manifolds and pressure switches.The portable/vertical line assembles tank-mounted compressors, which range from 3/4 to 5 hp. After assembly, every compressor from both lines is tested on a computerized test stand to verify performance and ensure quality conformance. Specific criteria are used for testing performance. These include motor electrical standards, pump requirements and the mechanical integrity of the compressor assembly.
Demos control chart system
The success achieved in reducing manufacturing losses at final test resulted from the company's commitment to continually improve product quality. To meet this objective, management decided to implement a continuous SPC program. This program was designed to catch defects at the point they occurred; in the process and identify immediate corrective action. IR chose the Demos control chart system.This system organizes all attribute and variable quality data into an integrated, plantwide SPC system. The system identifies and concentrates on the few major continuing problems and eliminates the wide proliferation of charts on minor or trivial problems. It summarizes all information into management control charts so that the program can be specifically directed by the management team.
Using a pyramid technique, inspection, scrap and rework data are integrated and organized into a series of control charts. The entire system includes over 1,000 items defect types, operators, machine operations and pan types.
With pinpoint accuracy, the system points out each out-of-control item as well as each item that has improved in performance. Also, the system routinely and automatically directs major effort and corrective action by the entire organization toward those areas that have the poorest quality.
Using this system, plant managers set as their objective a rejection rate that is lower every month than the previous month until 0.1 percent is reached. If at any time the rejection percent were higher than the previous month, it would indicate that the program had lost momentum and that a strong effort world be needed to re-establish it, until the...... rent month's percent again is the lowest point. For example, Figure 1 shows that upward trends occurred in December 1987 and April 1988.
The trend in December 1987 resulted from changes in assembly workers during holiday vacations, coupled with increased production requirements at that time. This trend reversed after cross training the assembly workers and maintaining continuity in assembly methods.
The upward trend in April 1988 resulted from a problem with small motor wiring fixtures. IR took up the problem with the motor manufacturer, resulting in improved methods and fixture controls at the supplier's site. Figure 1 shows that after corrective action the downward trend was re-established the following month.
Implementing the system
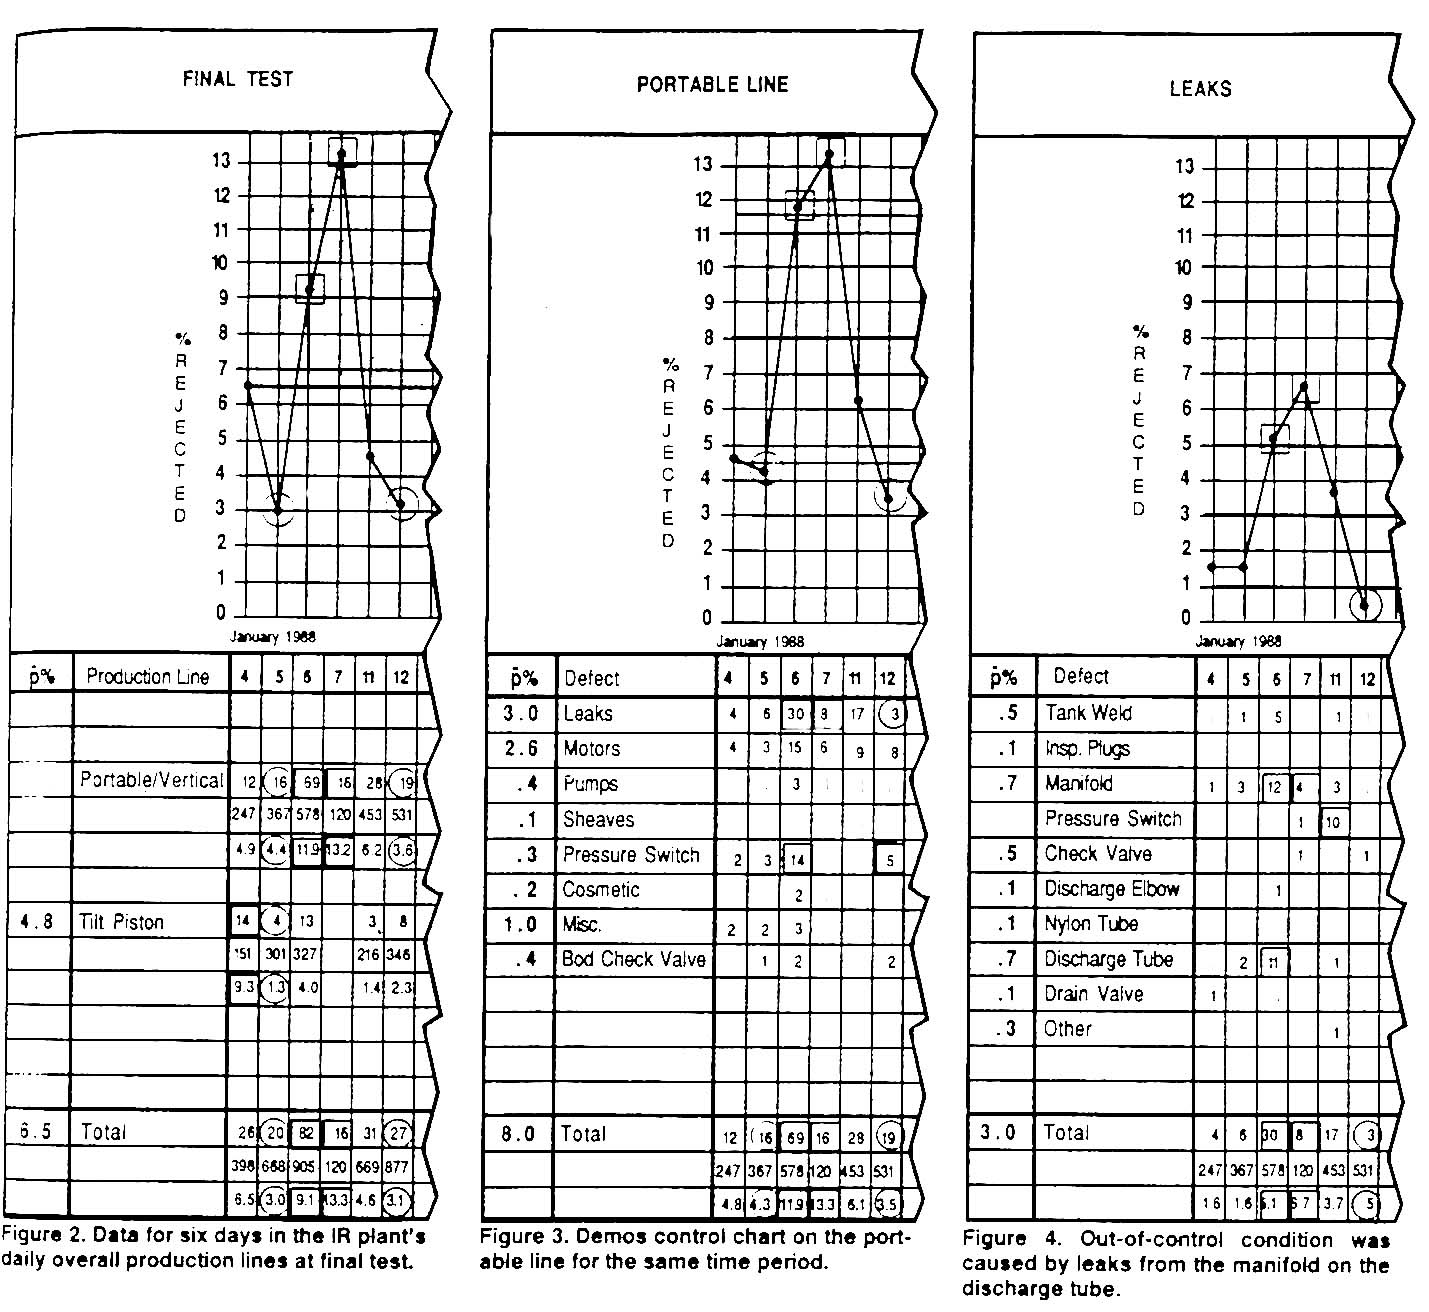
At the introduction of the Demos control chart system at the plant, managers gathered data at final test stations on each assembly line. These data were put on control charts to identify out-of-control conditions and to evaluate corrective action taken on their causes. Figure 2 shows the data for six days in the plant's daily overall production lines at final test.
.
The process averages (p%) appear in the left-hand column of Figure 2. Overall plant performance is 6.5 percent. The portable and tilt piston lines have process averages of 8 and 4.8 percent respectively. Daily performance for each line is shown progressively in the proper columns.On January 6, plant performance is 9.1 percent—the portable and tilt piston lines are 11.9 and 4.0 percent respectively. The chart indicates specific data and results since January have continued to show dramatic improvement.
When an entry exceeds the upper control limit for its process average, it is boxed in red; if it is below the lower limit, it is circled in green. The overall performance of the plant is out-of-control on the high side on January 6 and is worse on January 7. Performance is brought back into control on January 11 and, on January 12, performance is better than the lower control limit. The red boxes and green circles show that the portable line performance is responsible.
Figure 3 shows the Demos control chart on the portable line for the same time period. The portable line total percentage is out-of-control on the high side on January 6 and 7. It is in control on January 11 and is exceptionally good on January 12. The red boxes show that leaks and pressure switches caused the high out-of-control condition on January 6. The pressure switch problem had been solved the next day but not the leak problem. On January 11, both the leak and pressure problems had been solved. Even though the pressure switch problem reoccurred on January 12, the performance for leaks is so superior that the overall performance for the portable line is exceptional and plots below its lower statistical limit.
Figure 4 shows the Demos chart for Control Chart System leaks on the portable line for the same time period as in Figures 2 and 3.
Figure 4 shows that the out-of-control condition was caused by leaks from the manifold and the discharge tube. Although pressure switch leaks caused a problem one day, all leak problems were solved by January 12. Exceptional leak performance results are shown on January 12, and this performance is the main reason for the superior overall performance on this date.
92
Figure 5. Tables of improvement on the tilt piston line and portable line.
Corrective action
Once the problems were identified on the charts, corrective actions could be immediately taken. The main forum for corrective action at the plant is the daily action meeting. Each morning at 8:00 a.m. the operations manager meets with manufacturing and quality assurance supervisors and appropriate specialists. They review daily control charts, define current problems, review progress and agree on corrective actions.
The greatest overall improvement was in reducing air leaks in the portable line. An 83-percent reduction was achieved by reducing the initial percentage of leaks from 6.5 to the latest value of LI percent.
IR identified several corrective actions needed to reduce leaks in the portable line. Training began immediately to achieve better discipline in the process. Upgrading of the tooling improved efficiency. Experiments were designed and monitored to qualify the methods, tools and process. Also, rearranging the assembly lines produced better control of material flow and balanced assembly operations.
Another significant result came out of a supplier-oriented quality problem with motors. IR requested a resident quality engineer from the motor supplier. He and the IR plant workers monitored all defect characteristics and identified the root causes. After mutual agreement as to what the problems were, they took corrective actions. Some were taken in Energair's plant, others in the supplier's plant.
Engineers monitored these corrective actions on the portable line and data-FAXed control charts on the supplier's motor assembly facility. These charts clearly pointed out the problems requiring correction at the supplier plan; tracked them as they were addresses Root cause identification and corrective action on the product lines initiated minor design changes and overall product improvement.
On the tilt piston line, the system identified specific failure modes and, as with the portable line, called for extensive in volvement with the motor manufactur for corrective steps.
They agreed upon design changes an addressed assembly criteria at both the small compressor plant and the manufacturer's facility. The SPC charts monitored these changes at the small compressor plant and feedback was data-FAXed daily to the supplier. Batch lots were identified to maintain control as each batch was monitored.
IR management believes that the benefits achieved by the continuous quaiitimprovement program are many. The actions that reduced rejections at final test automatically and simultaneously improved product qualty. Also, the benefits of reducing rejections significantly reduced quality costs. For example, a reduction in the rejection rate:
• Generated savings in scrap and rework costs.
• Reduced failure costs.
• Reduced in-process inventories.
• Improved delivery performance.
• Increased productivity.Therefore, rather than costing the company money, this quality improvement program made money. By reducing the rejection rate, quality improvement was free.
Another benefit was the increased visibility of problems. Through the visibility achieved with the Demos system, problems are defined—whether within the process or at the supplier's site. This information becomes a valuable tool when dealing with a supplier-oriented quality problem and permits an unemotional and objective discussion of the problem. Thus, the continuous quality program used at the Davidson plant has become an external program for constant quality improvement by some of its major suppliers.
-----------------------
P.J. COOPER is quality assurance supervisor with Ingersoll-Rand, Energair Div.. Davidson. NC NICK DEMOS is a quality consultant.
School of Technology
College of Business & Applied Sciences
Eastern Illinois University