A scatter chart or diagram is useful tool for identifying a potential relationship between two variables, sometimes cause-effect relationship. Data are collected in pairs on the two variables, say (yi, xi), for i=1,2,3 ...,n. The value of yi is plotted against the corresponding xi. The shape of the scatter diagram often indicates what type of relationship may be occurring between the two variables.
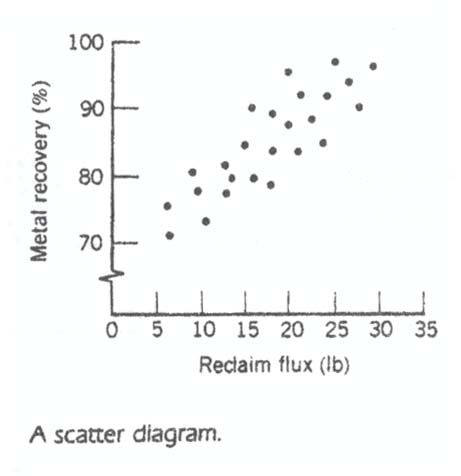
The figure below shows a scatter chart relating metal recovery (in percent) from a magnathermic smelting process for magnesium against corresponding values of the amount of reclaim flux added to the crucible. The scatter diagram indicates a strong positive correlation between metal recovery and flux amount. As the amount of flux added is increased, the metal recovery also increases.
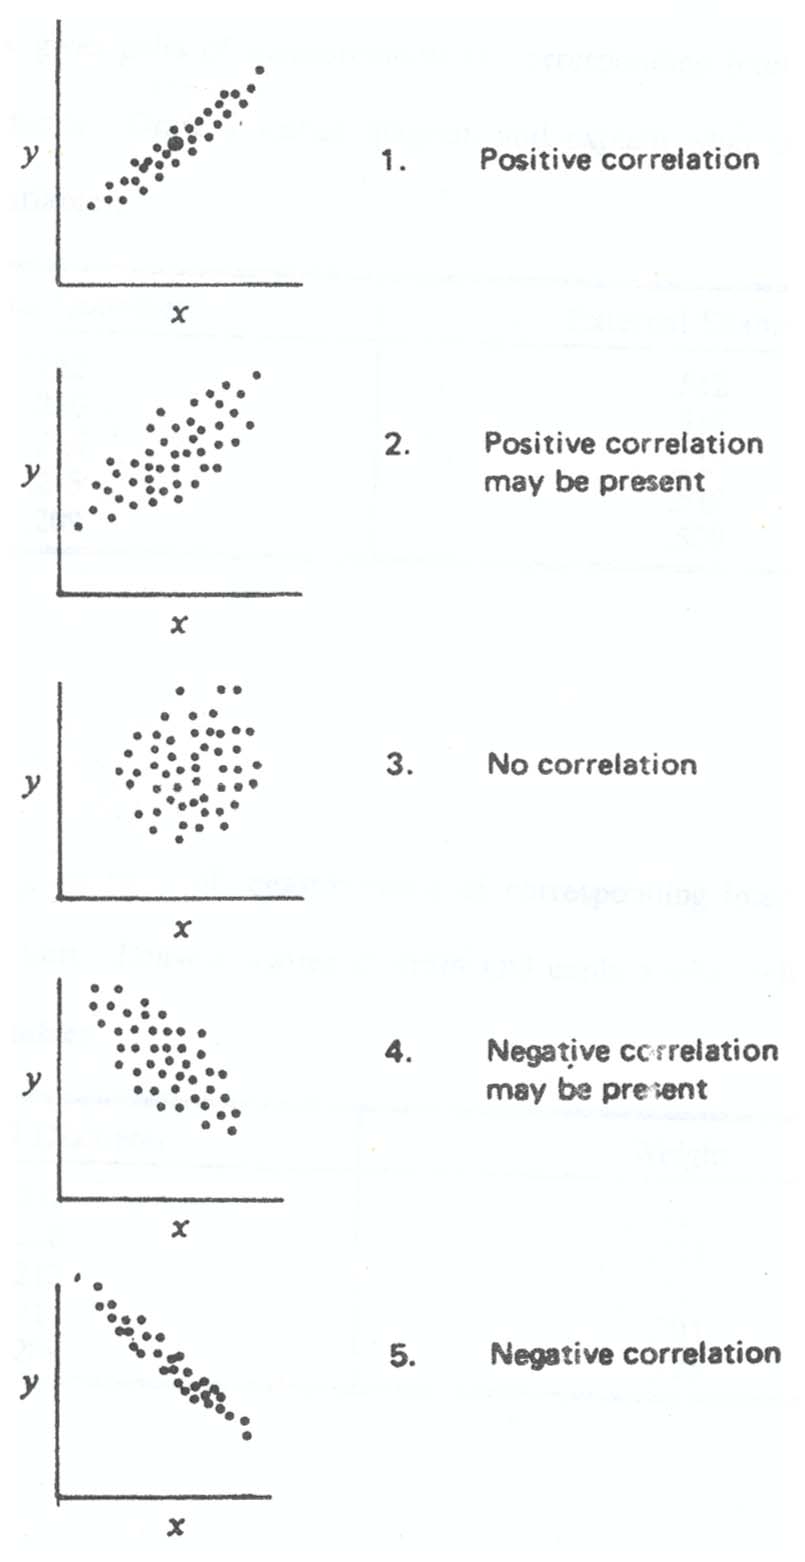
The pattern shown by the scatter diagram can give manufacturing personnel much information about the relationship between two variables, as in the following page.
Figure 2.16. Interpretation of scatter diagram. (From K.Ishikawa, Guide to Quality Control, 2nd Rev. ed., Asian productivity Organization, 1982. Reprinted by permission.)
WORKING EXAMPLES
1. The table below gives pairs of measurements of corresponding internal and external diameter measurements. Draw a scatter diagram and explain what relationship exists between the two variables.
2. The table below gives pairs of measurements of corresponding internal and weight measurements for a part. Draw a scatter diagram and explain what relationship exists between the two variables.
3. The following table shows results of an experiment regarding Measurement A in relation to RPM. Configure a scatter diagram and explain the correlation between the two variables. Can the Measurement A be controlled through the control of RPM. How is the control done?
4. Two top adapters are measured for a manufacturing process to see whether there is correlation between them. The measurement results are shown below. Draw a scatter diagram and explain the correlation between the two measurements.
School of Technology
College of Business & Applied Sciences
Eastern Illinois University