Honda employees didn't need high technology to save money
by Gary P. Maul and John Scott Gillard
Ninety percent of US industries do not know how to solve chronic quality problems. The reason why is that chronic problems are so deeply embedded in processes that they seem normal. This does not mean the problems are not real or costly, only that they are buried.Fortunately, chronic problems do not have to be solved by an elite few using sophisticated mathematics. They can be solved by employees using simple tools to find and eliminate root causes.
Employees in the Paint Department at Honda of America Manufacturing automobile plant in Marysville, OH, found this out firsthand. The Paint Department had a chronic problem: One paint line (line 1) used more electrostatic coating (E-coat) pigment than the other (line 2).
For three years, however, it was not considered a problem because there were many "reasons" to explain the difference:
• The mix of car models painted on the lines was different. Station wagons were painted on line 1 and not on line 2; they have a larger surface area than four-door models. In addition, line 1 painted more two-door models than line 2; two-door models have a smaller surface area than either the station wagon or four-door models.
• Production amounts varied daily.
• Line 1 was four years older than line 2 and was not identically equipped.An employee, however, made some simple calculations and constructed a histogram. The usage difference turned out to be a chronic problem because production amounts, production mix, and normal variation could not explain the difference. Line 1 used significantly more pigment per square foot of body surface area than line 2.
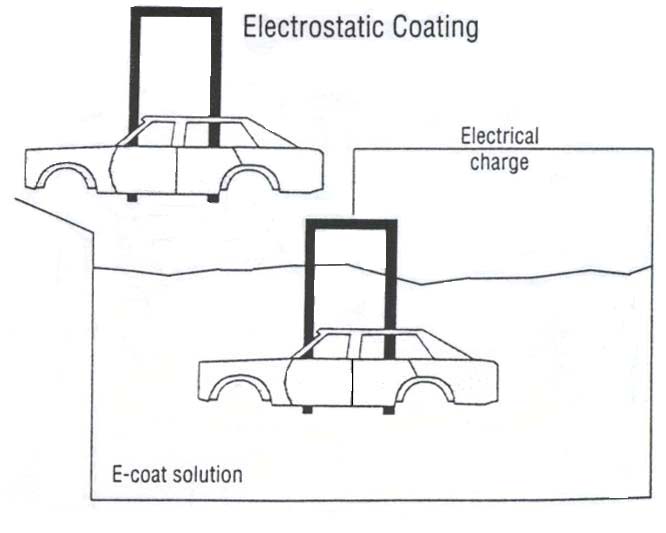
To apply the E-coat, a car body is dropped into a solution of water and pigment (Figure 1). The body is electrically charged relative to the solution. Pigment deposits on the body surface form the primer. When the primer is complete, the body is raised out of the solution, drained, and dried before the top coating is applied. The solution drains back into the tank; therefore, the pigment cannot leave the system other than on a car body. A system automatically replenishes the solution.
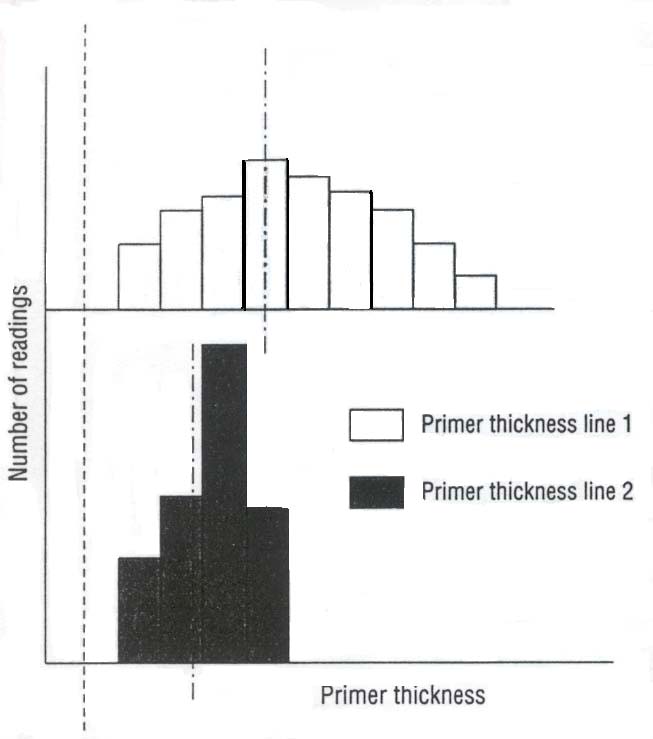
The employees concluded that the primer coat, on average, must be thicker on line 1 than on line 2. Measuring and plotting samples from both lines showed a difference proportional to the earlier pigment usage difference (Figure 2). The plot also indicated a much wider thickness variation on line 1. This was not revealed in previous data.
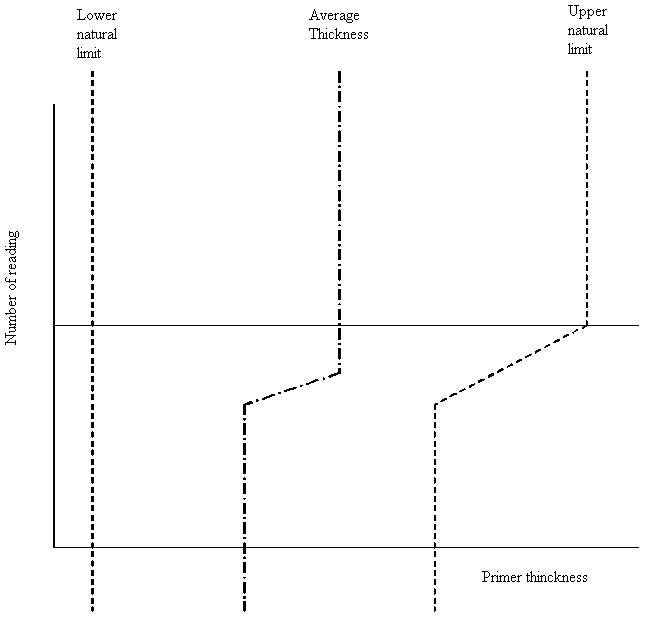
The averages differed because the lines are tuned to ensure that the car bodies have no less than the minimum thickness of primer (i.e., lower natural limit is held at the minimum specification). The line with the greater variability (line 1) had a greater average thickness (Figure 3).
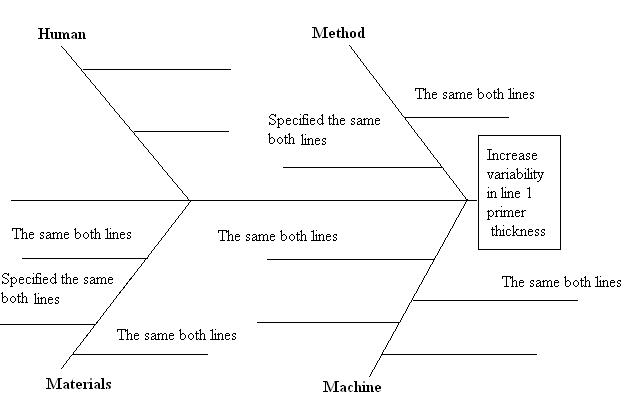
Systems thinking teaches one to look at variability in a system's inputs to find the cause of variability in the output. The E-coat system's inputs are shown in Figure 4. Variability in any one or any combination of these inputs could cause the primer thickness variability.
Figure 1. How Car Bodies Are Coated
The employees could have used classical design of experiments to find the possible cause that contributed the most to variability. With eight possibilities, however, this would have required a large effort. Even using Taguchi techniques would have required considerable effort. So, before doing a large-scale experiment, the employees used simple tools to eliminate many causes.The problem statement—Line 1 uses more pigment per square foot than line 2—and the knowledge that this was due to greater variability enabled the employees to eliminate some inputs as causes. The root problem was not the absolute amount of pigment used on line 1 but its greater variability. It followed, therefore, that factors common to both lines were probably not critical because they would contribute equally to both lines' variability. Thus, the following factors were eliminated:
• Time in bath
• Specified temperature
• Current controls
• Hangers
• Type of pigment
• Specified solution strength
• Electrodes
Logic had reduced the number of possible causes that could be part of an experiment, but simple techniques were applied to reduce the number even further. The remaining possible causes were:
1. Line stops and starts. The starting and stopping for minor production difficulties on line 1 were not necessarily the same as those on line 2. Every effort to control this cause was already being made. If this were the cause of the variation, nothing could be done about it.2. Cleanliness. Line 1 was not as clean as line 2 because of its basic tank design. Cleaning line 1's tank is a major undertaking and requires shutting down the line for a week. Historical records, although incomplete, showed that the difference in usage was evident even after line 1 's tank was cleaned. Thus, this cause was unlikely.
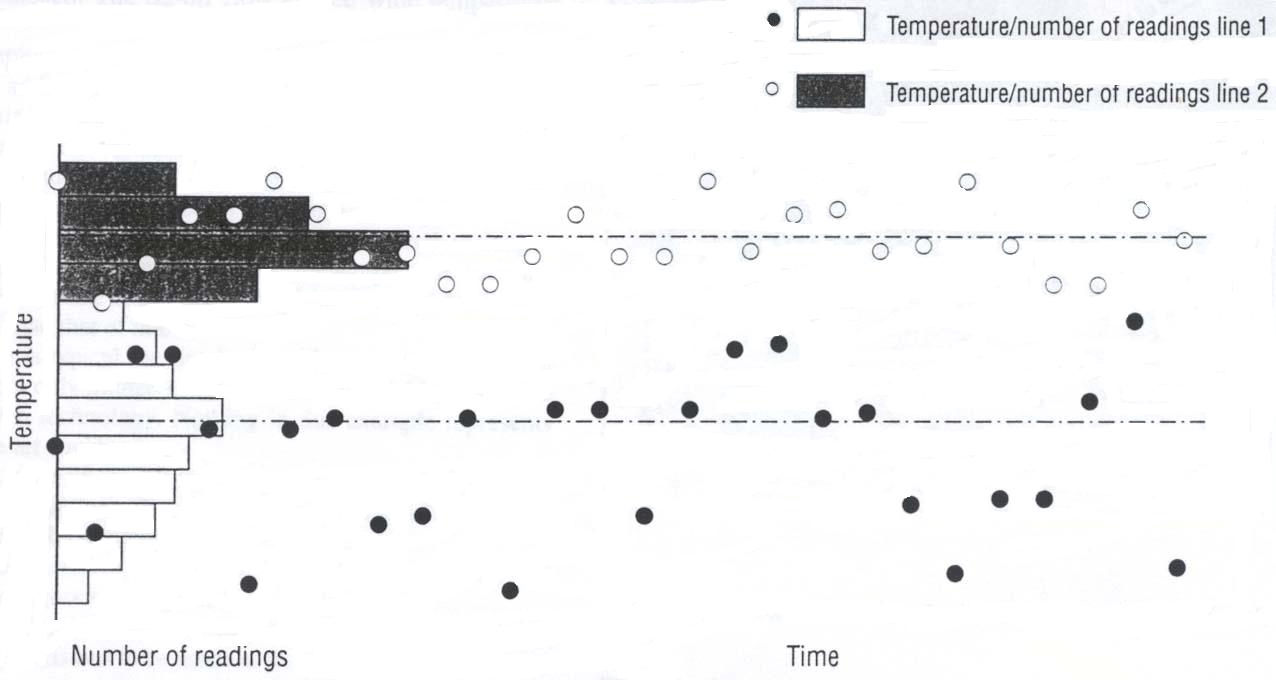
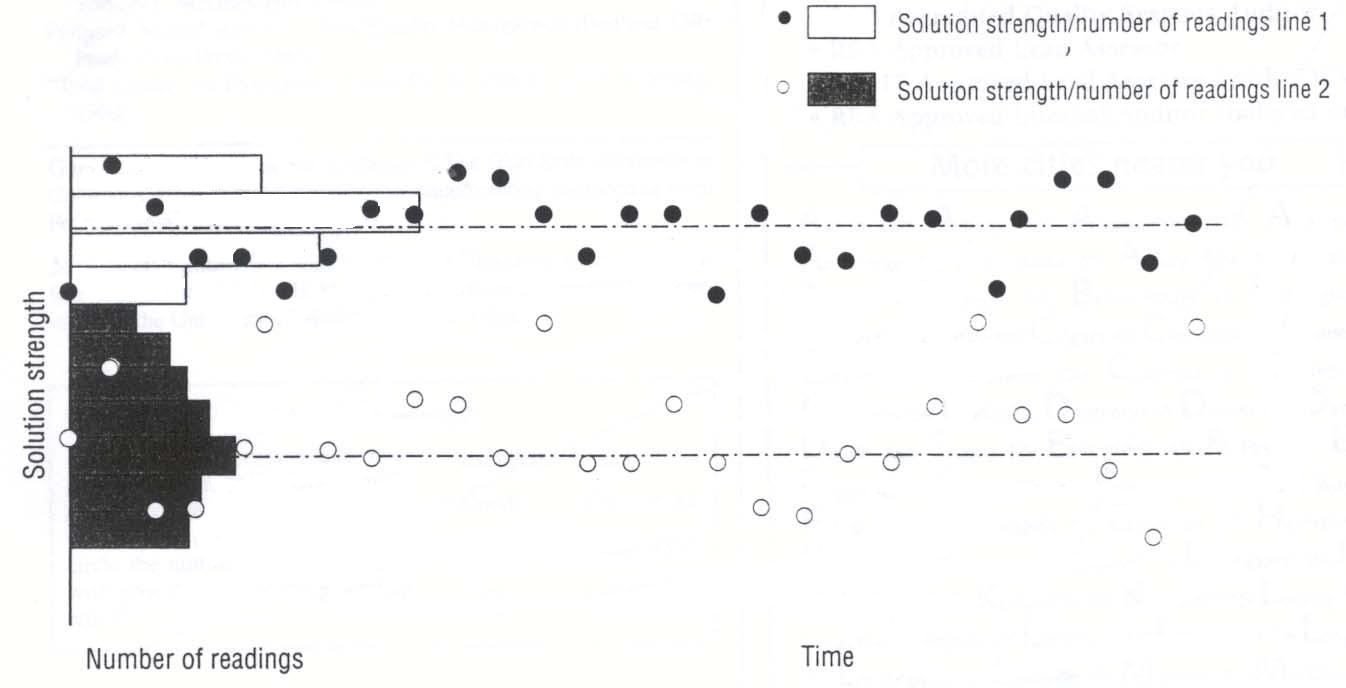
3. Temperature control system. The speed of E-coat deposition related directly to the temperature of the bath. Any variability in the temperature results in variability in the thickness. This was a likely cause.4. Solution make-up system. The pigment solution strength was directly related to the speed of E-coat deposition. Any variability in this strength results in a variable primer-coat thickness. This was a likely cause.With only two possible causes to address, simple measurements were taken to confirm which was the most likely one. The first measurement taken was the E-coat bath temperatures. Histogram-run charts were plotted over four shifts (Figure 5). They showed a difference in both the average temperature and temperature variability in the two baths. Measurements were then taken and plotted for the solution strength. These charts also showed differences in average and variability (Figure 6).
In the temperature chart, the average was higher on line 2 and the variability was higher on line 1. In the solution-strength chart, the opposite was true. Line 1 had a slightly higher average, and line 2 had greater variability.
Most likely, temperature was the critical factor because the greater temperature variation on line 1 correlated to that line's greater thickness variation. In contrast, line 2 had wider swings in solution strength but had less variation in thickness. This indicated that solution-strength variability was an unlikely cause. Strong indications were that controlling the temperature swings on line 1 would reduce the pigment usage.
A simple system controlled the temperature of line 1. (The control systems on the newer line 2 were much more sophisticated than the older systems on line 1.) A thermocouple signaled a gate valve to open when the temperature fell below a certain level. When the temperature rose above another point, the valve closed. The on-off flow caused wide temperature swings.
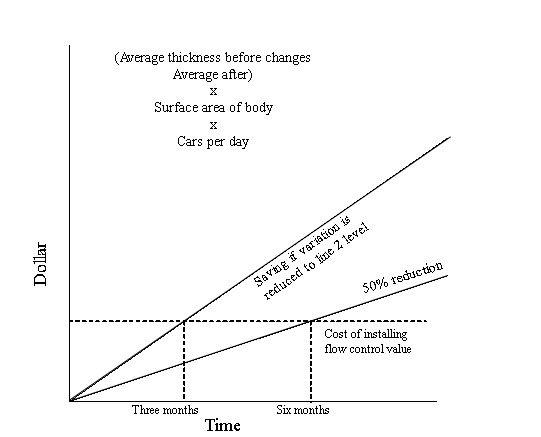
The employees determined that these swings could be controlled by adding a programmable logic controller and a variable opening control valve. A simple break-even diagram showed that, if the variability were lowered to the line 2 level, the change would pay for itself in three months (Figure 7). Even if the variability were reduced by only 50%, the payback would come in six months. Therefore, the change was worth making.
After installing the new equipment, the temperature variation was less than on line 2. Similarly, the pigment usage declined to a level less than that of line 2.
This case is typical for Honda. Significant cost savings have resulted from only limited effort. Installing a variable flow valve was not high technology. Nothing in this example represents state-of-the-art engineering.
What is state of the art is the management techniques that fostered these actions. The employees could not have solved this chronic problem without management:
• Being committed to the company's vision and spreading that vision throughout the organization
• Educating the work force in simple but powerful quality tools
• Allowing decisions to be made at an appropriate levelProper management support is critical in becoming part of the 10% of US industries that do know how to solve chronic quality problems.
Figure 2. The Primer Thickness Is Significantly Higher on Line 1.
Figure 3. Greater Variability Results in a Higher Average With the Lower Natural Limit Help Constant
Figure 4. The Possible Causes of the Variability Are Identified
Figure 5 Line 1 Has a Lower Average Temperature and Greater Variability Than Line 2.
Figure 6. Line 1 Has a Higher Average Solution Strength and less Variability Than Line 2.
Figure 7. Payback Time is Short, Even at 50% Reduction
Reference
1. Keki R. Bhote. World Class Quality (New York. NY: AMACOM, 1991).
Bibliography
Ishikawa. Kaoru, What Is Total Quality Control? The Japanese Way (Englewood Cliffs, NJ: Prentice Hall.' 1985).
Karatsu. Hajime. TQC Wisdom of Japan (Portland. OR: Productivity Press. 1988).
Ott. Ellis R.. and Edward G. Schilling, Process Quality Control (New York. NY: McGraw Hill. 1990).
Perigord. Michel. Achieving Total Quality Management (Portland, OR: Productivity Press. 1990).
"Total Quality- on Executive's Guide for the 1990s," Ernst & Young, 1990.
------------------------------------
Gary P. Maul is an associate professor at The Ohio State University in Columbus. He received a doctorate in manufacturing engineering from Pennsylvania State in State College.John Scott Gillard is a staff engineer at Honda of America Manufacturing in Marysville, OH. He received a master's degree in engineering from the University of Michigan in Ann Arbor.
School of Technology
College of Business & Applied Sciences
Eastern Illinois University